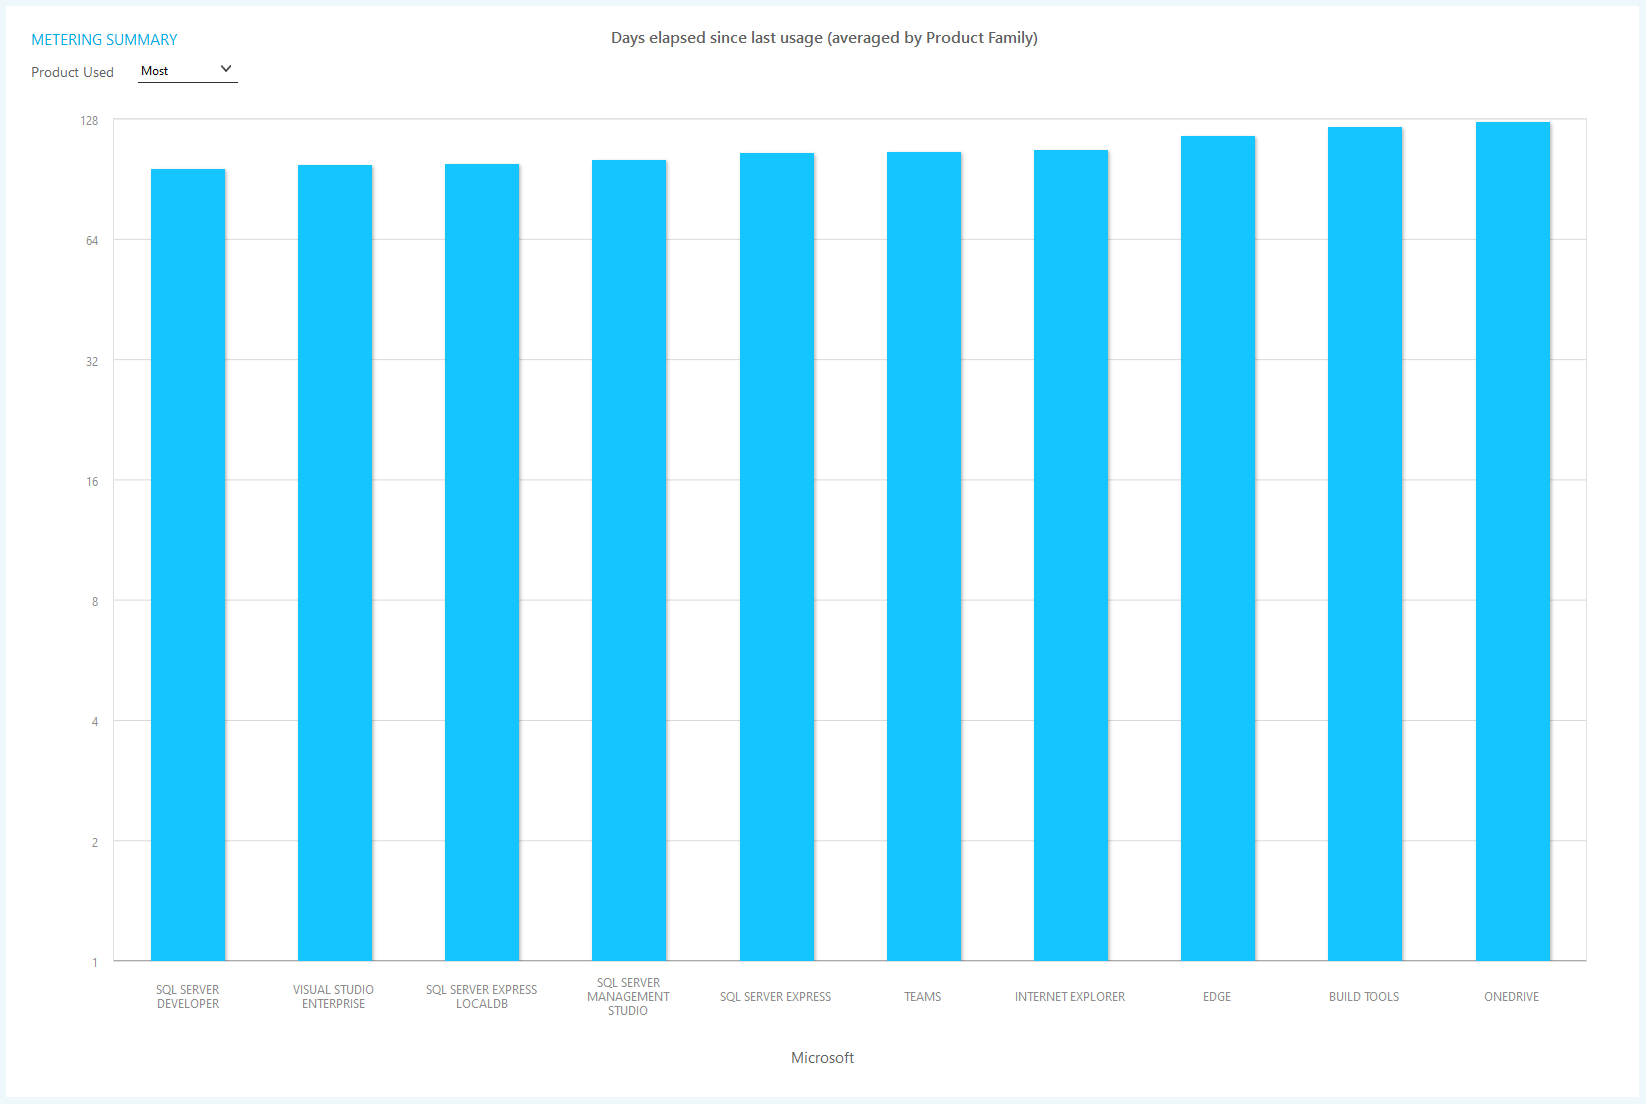
Days Elapsed Since Last Usage Chart
The Days Elapsed Since Last Usage chart displays the average length of time since a product or product family was last used on the devices in the organization. This chart is shown when you drill down from the metered products by manufacturer chart or another days elapsed since last usage chart. You can use Dashboard Settings to change the number of displayed columns. You can drill into the data. You can also launch Software Metering reports for each column in the table.
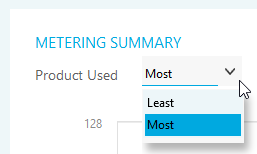
Days Elapsed chart can be organized by the most or least used installations. Click the drop-down box above the chart to change the display.
Right click on any bar in the chart for drill and report options:
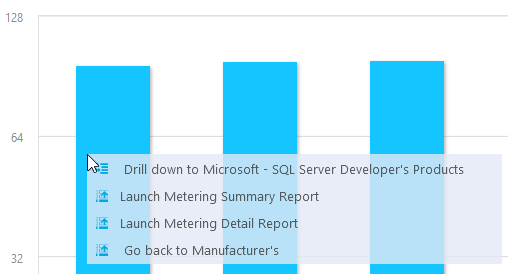
- Click Drill down to... to launch the days elapsed since last usage chart or the breakdown of last usage across all installations chart for the specified column.
- Click Go back to... to go back up to the chart from the previous drill down.
- Click Launch... to launch the associated report.